The goal of this project was to design a portal for KPN where they would be able to follow the vectorisation process of their underground electric network. For this project another designer had already put in some work, but the design was far from finished. My job was to further the design and get it ready for testing.
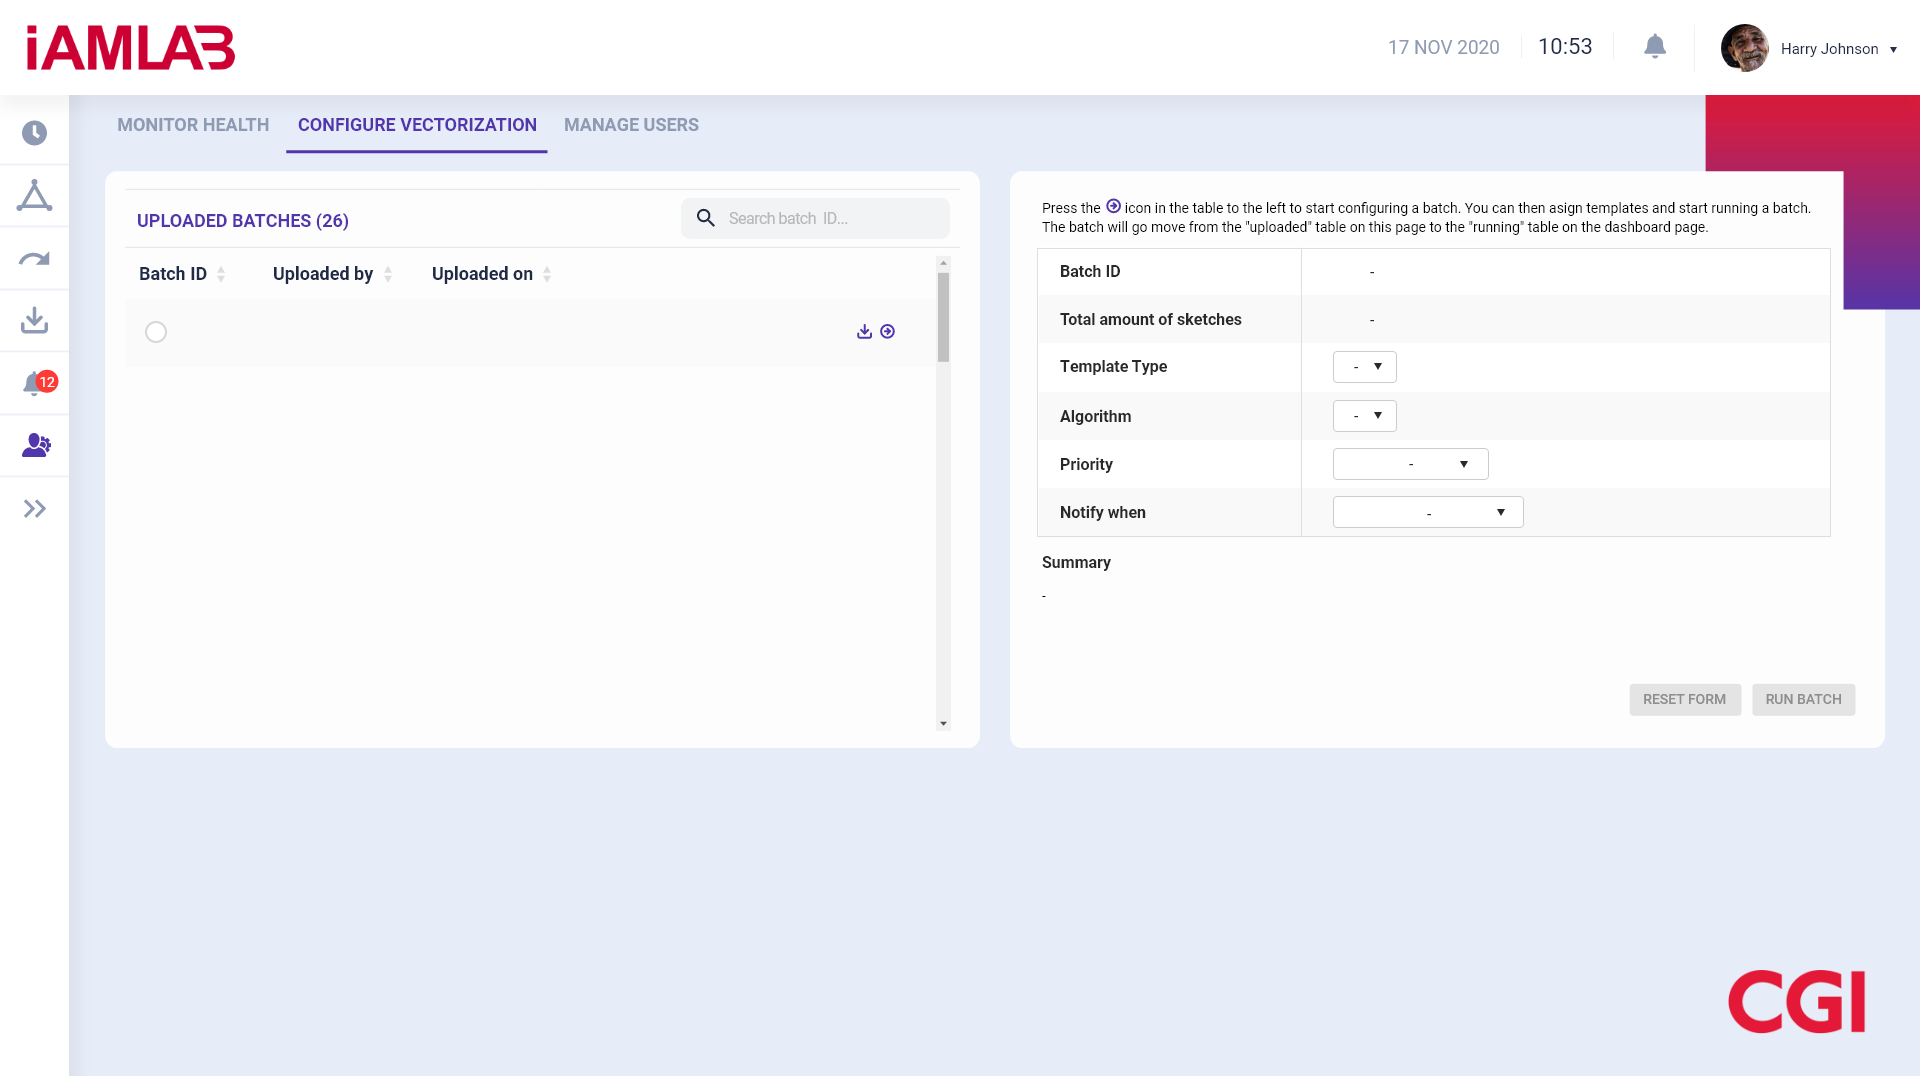
Condensing the vectorisation process was very important in this case. It’s a difficult and long process that needed to be displayed and be interacted with within the portal. Something that was of the utmost importance was the User Flow. To make sure that the user would be able to get the information they needed in as little time possible.
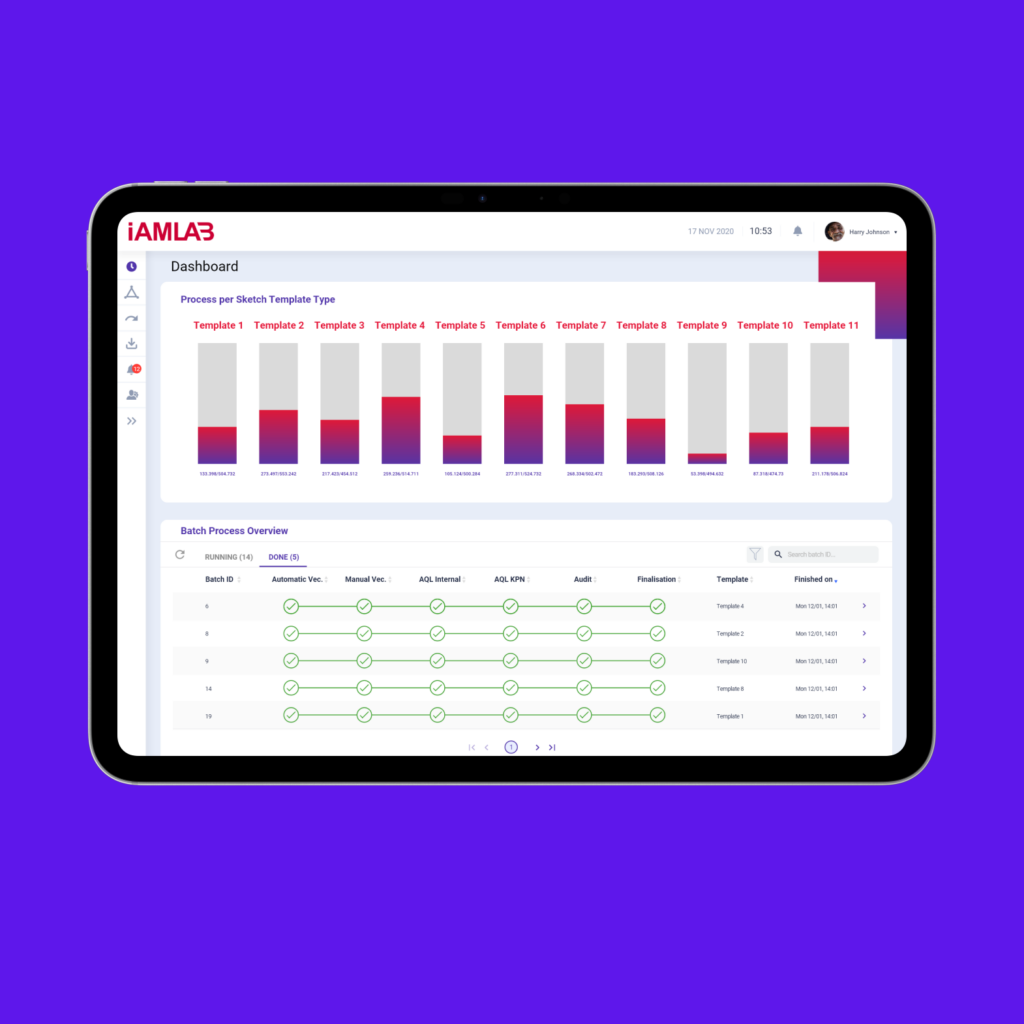
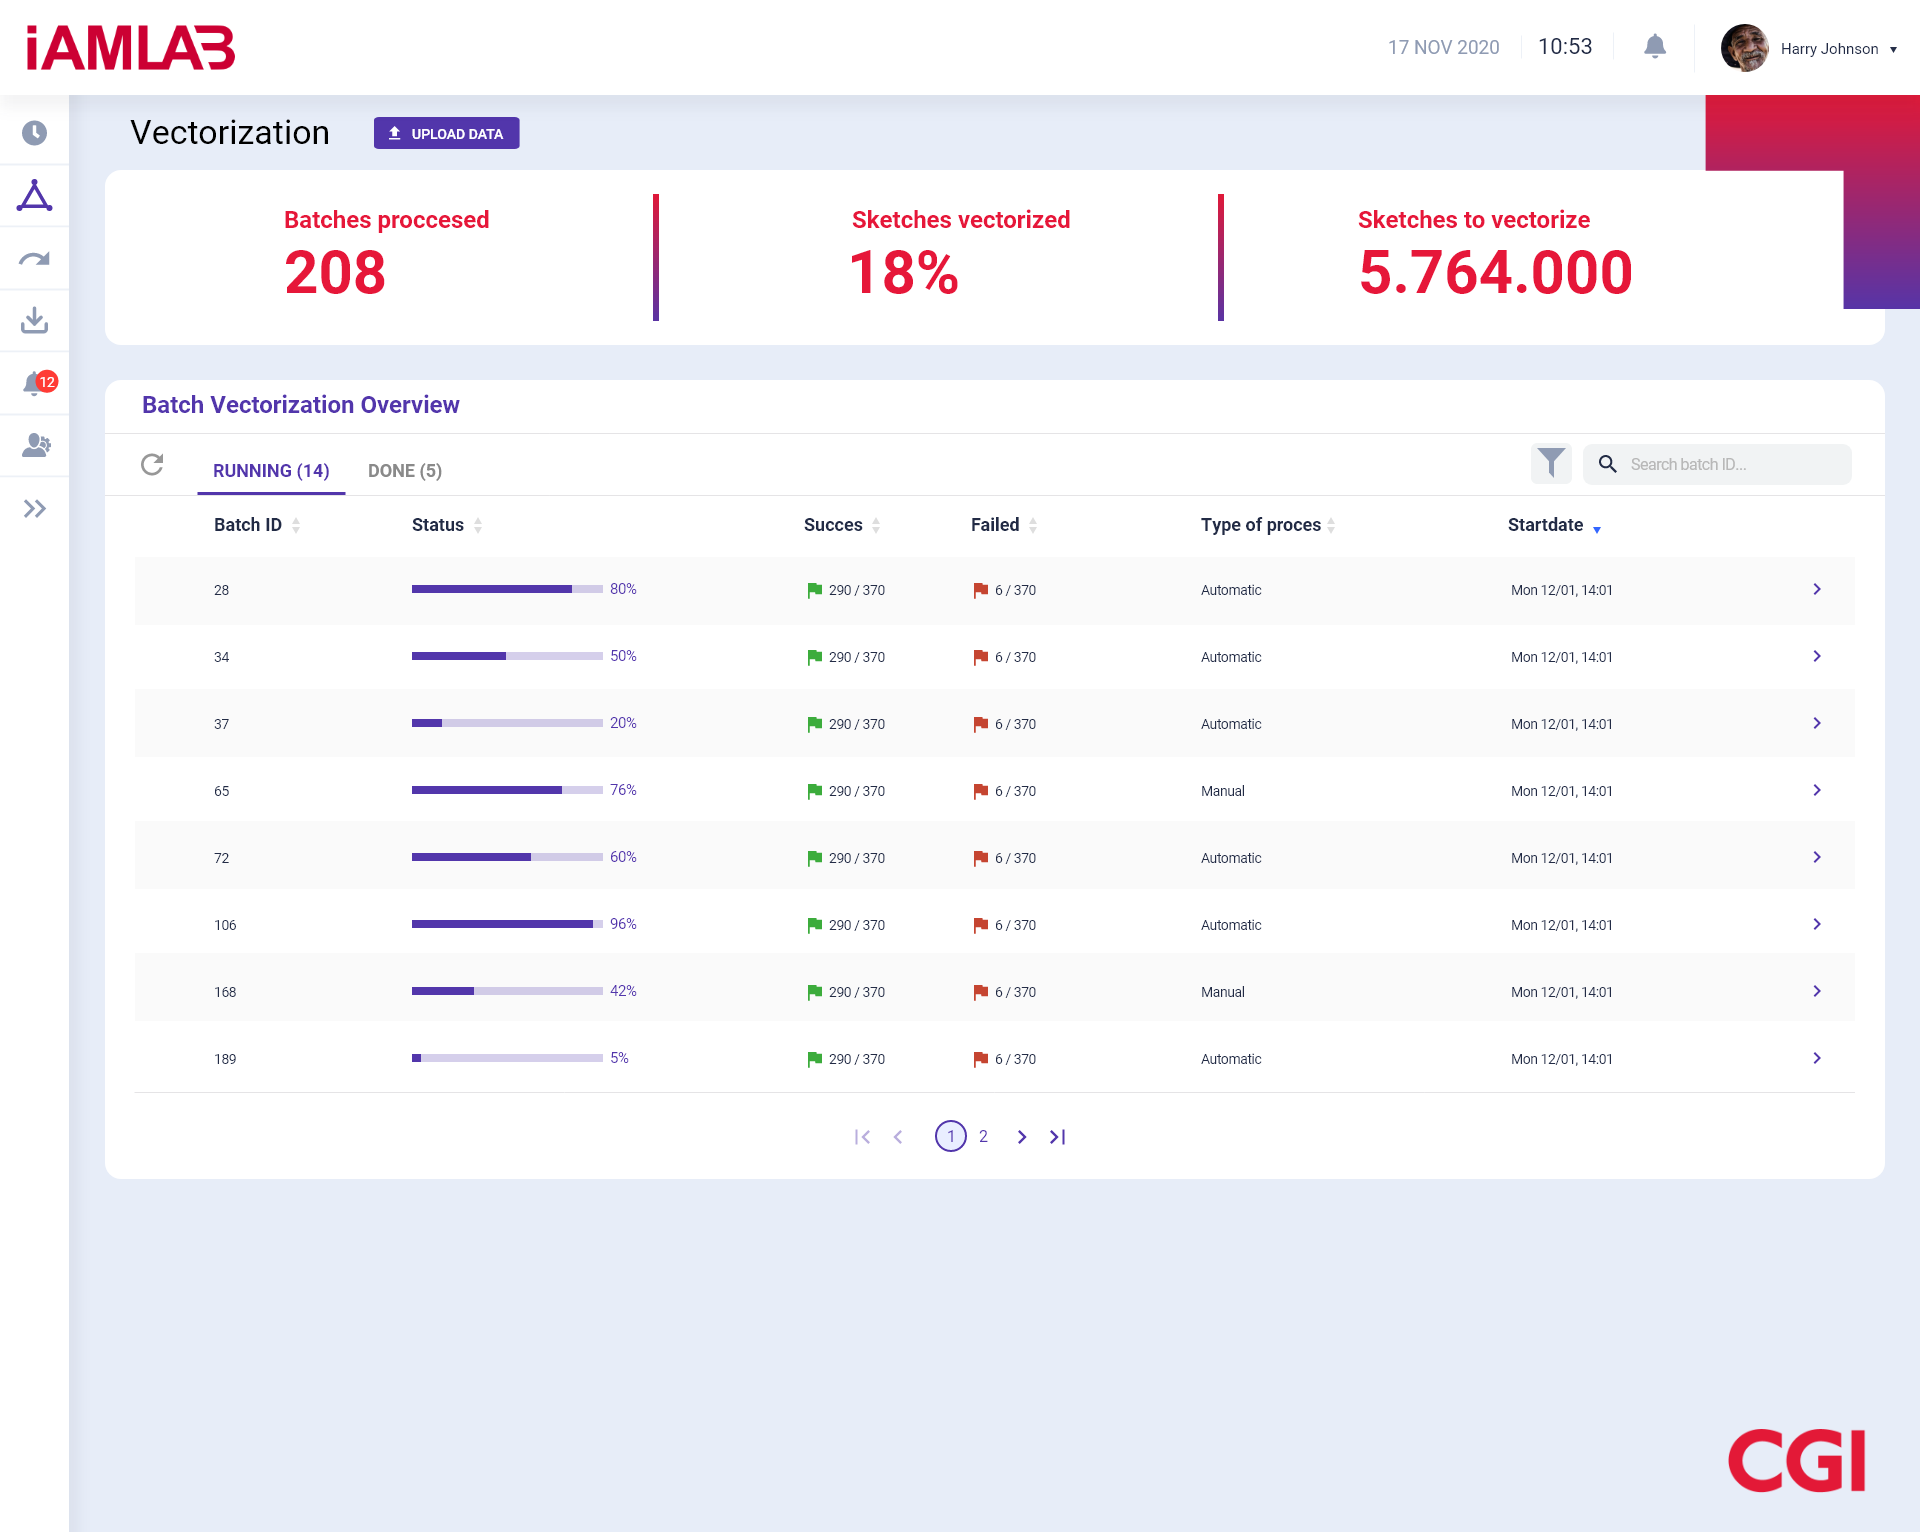
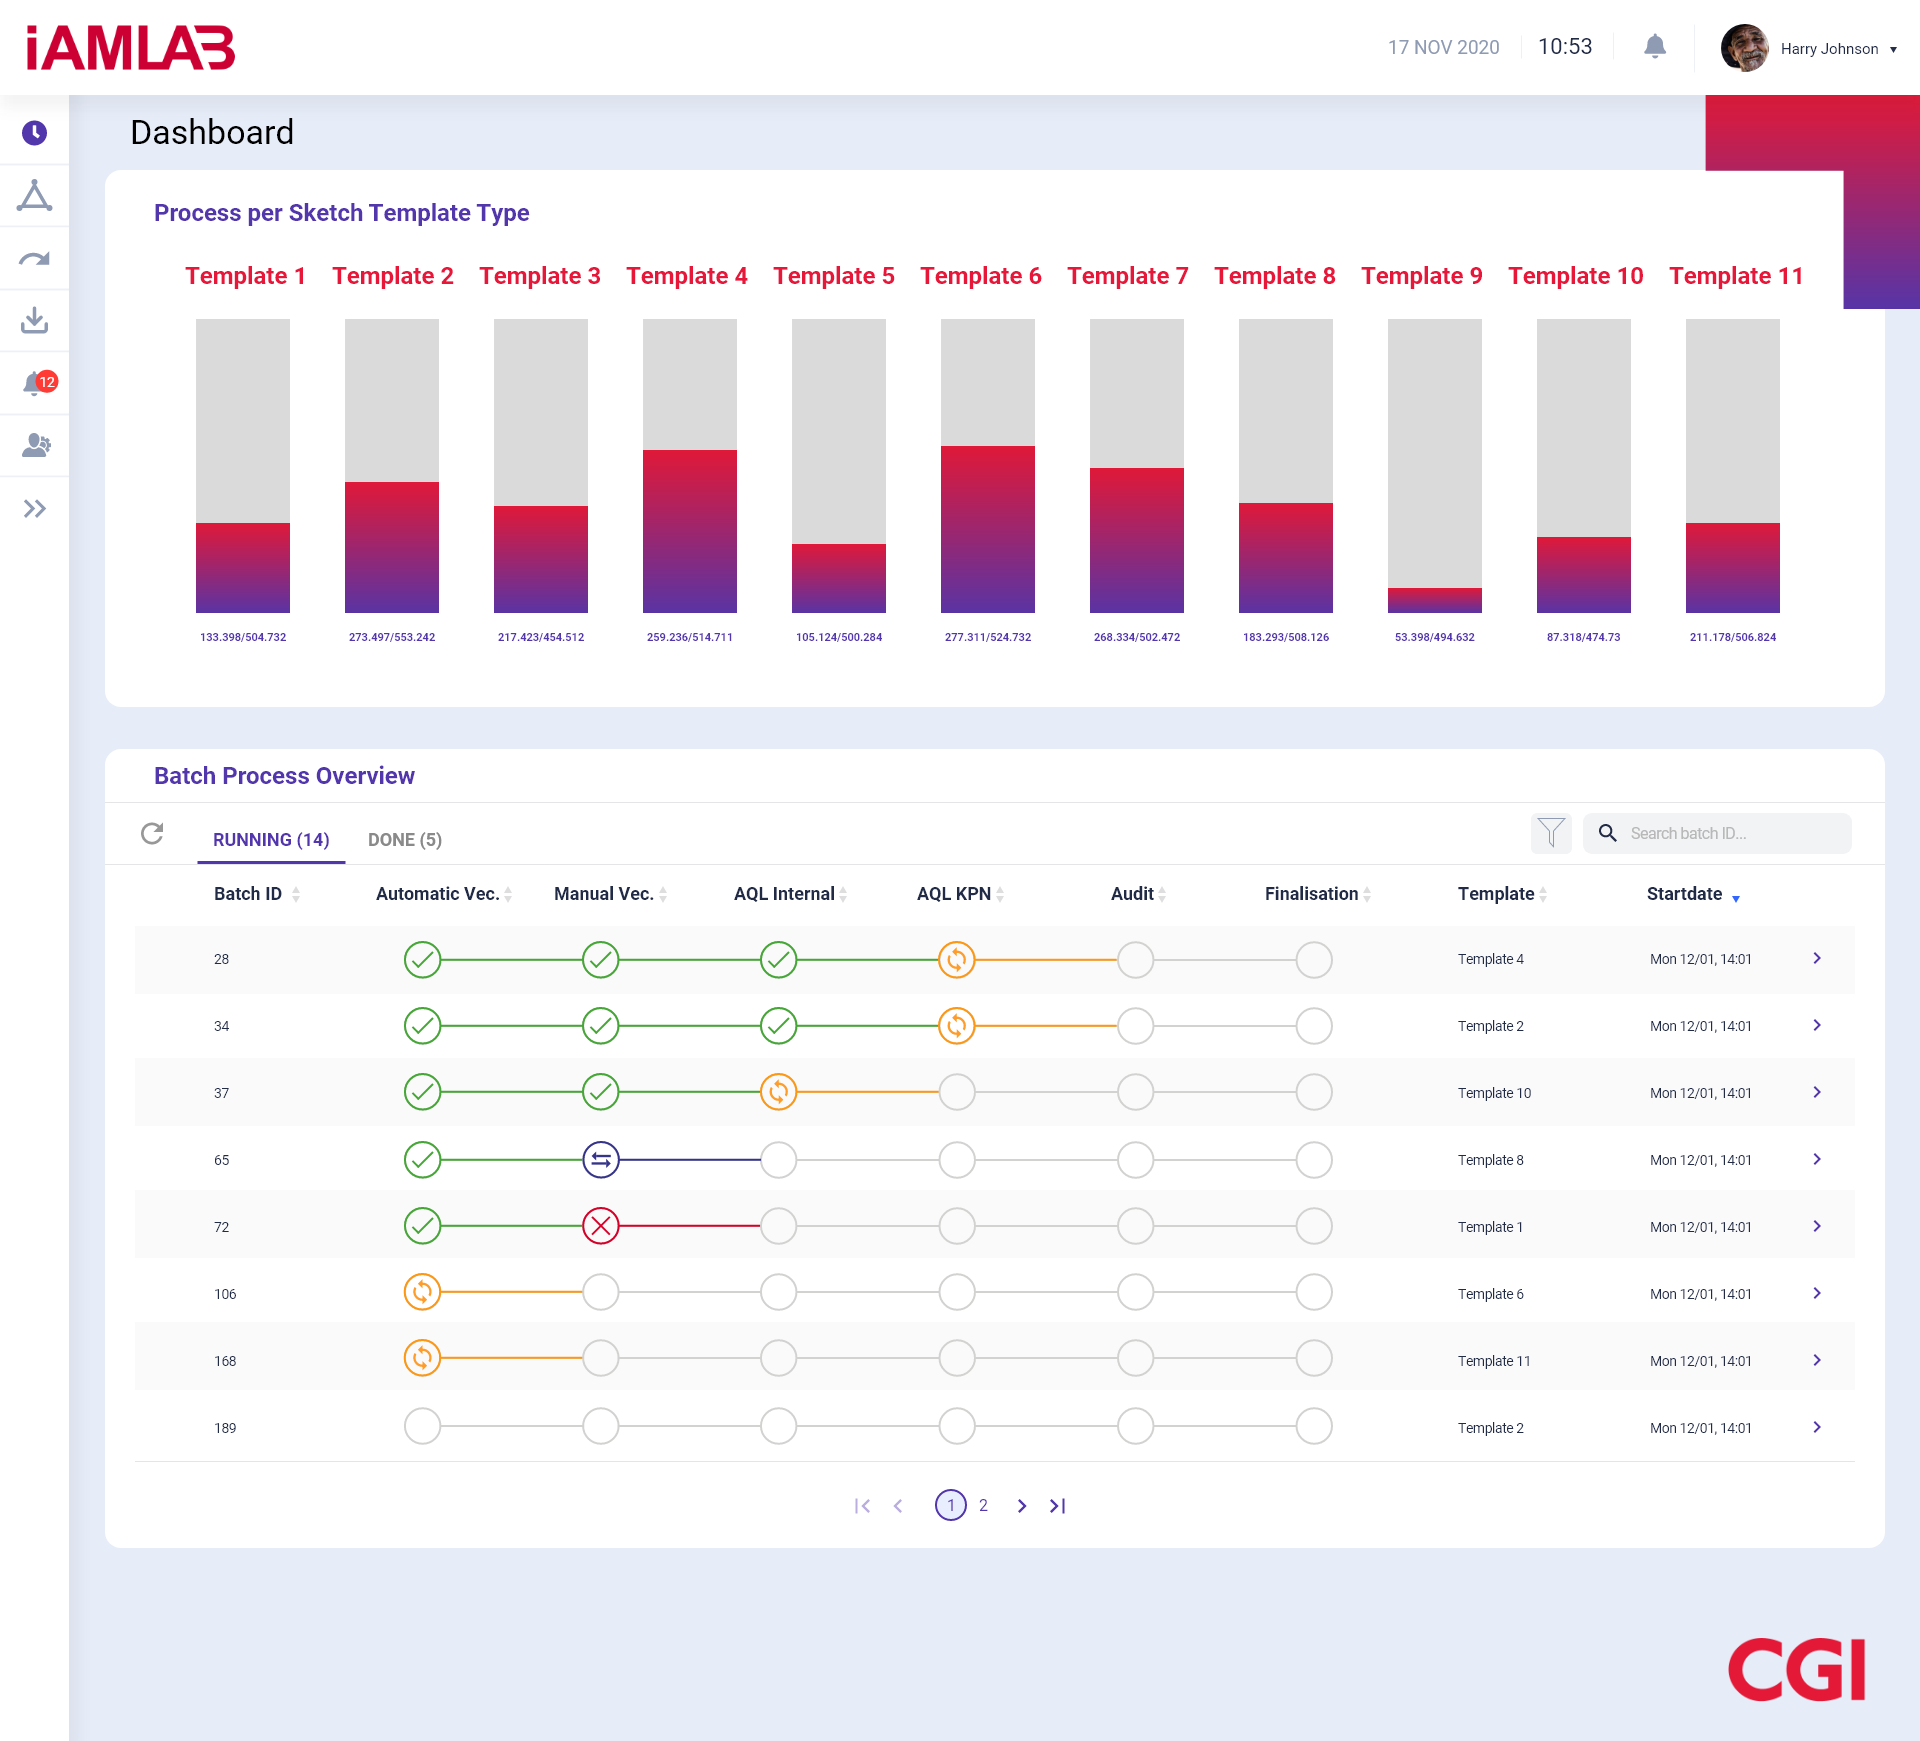
Because of this, the information about the total process and the larger batches of data is found on the default page, the Dashboard. This page give a quick overview of the different ongoing processes. By visualising the total amount of converted data and the progress stages of each batch it is easy to quickly pick up on most general information.
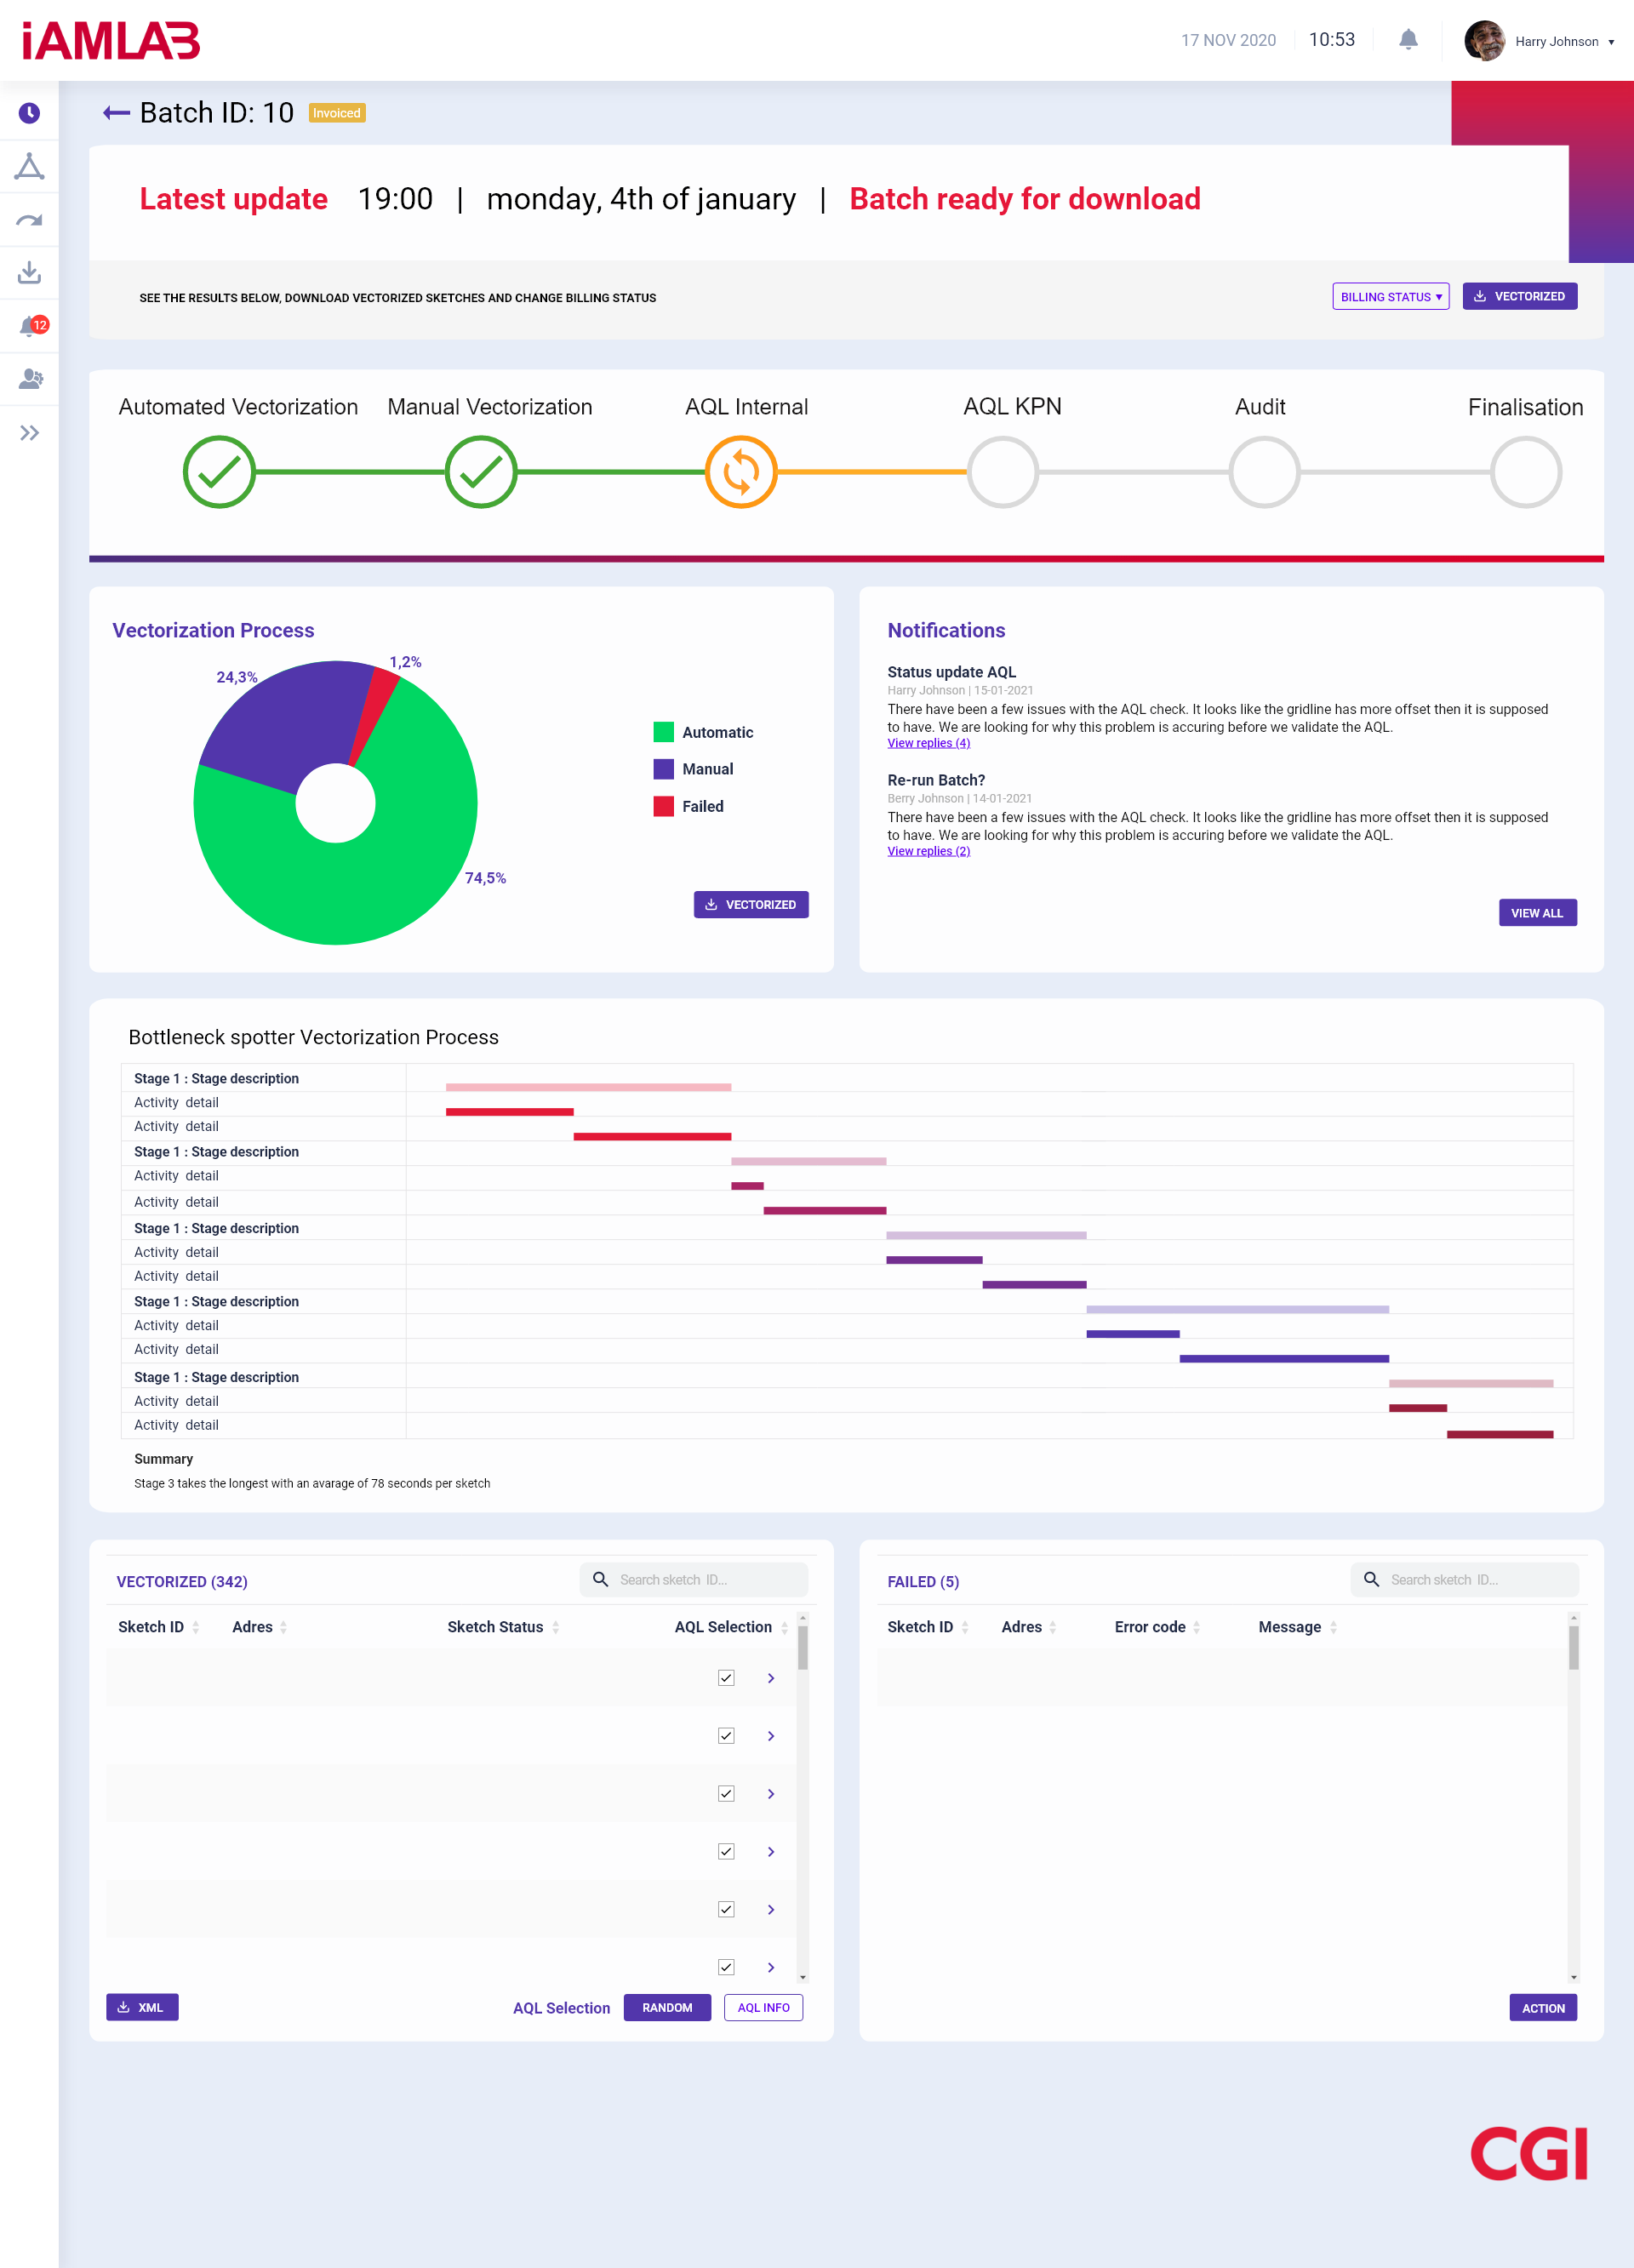
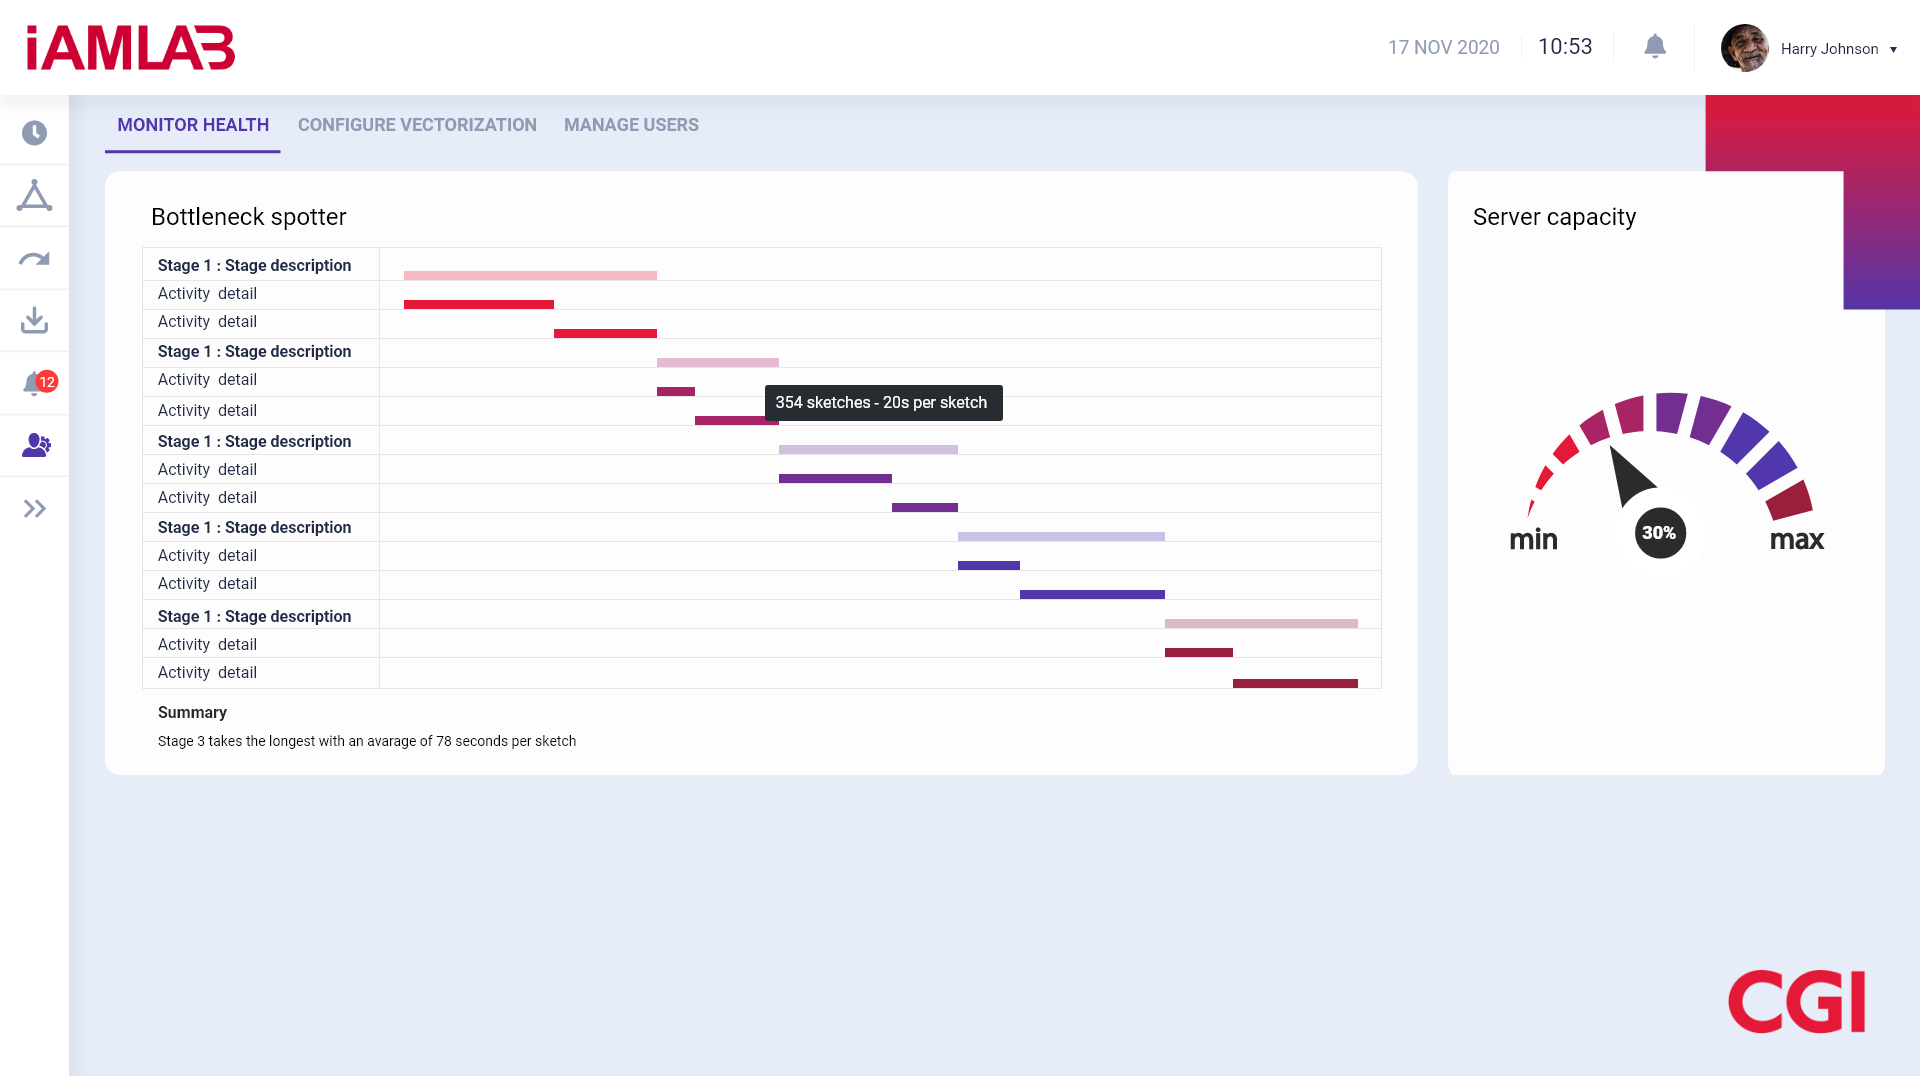
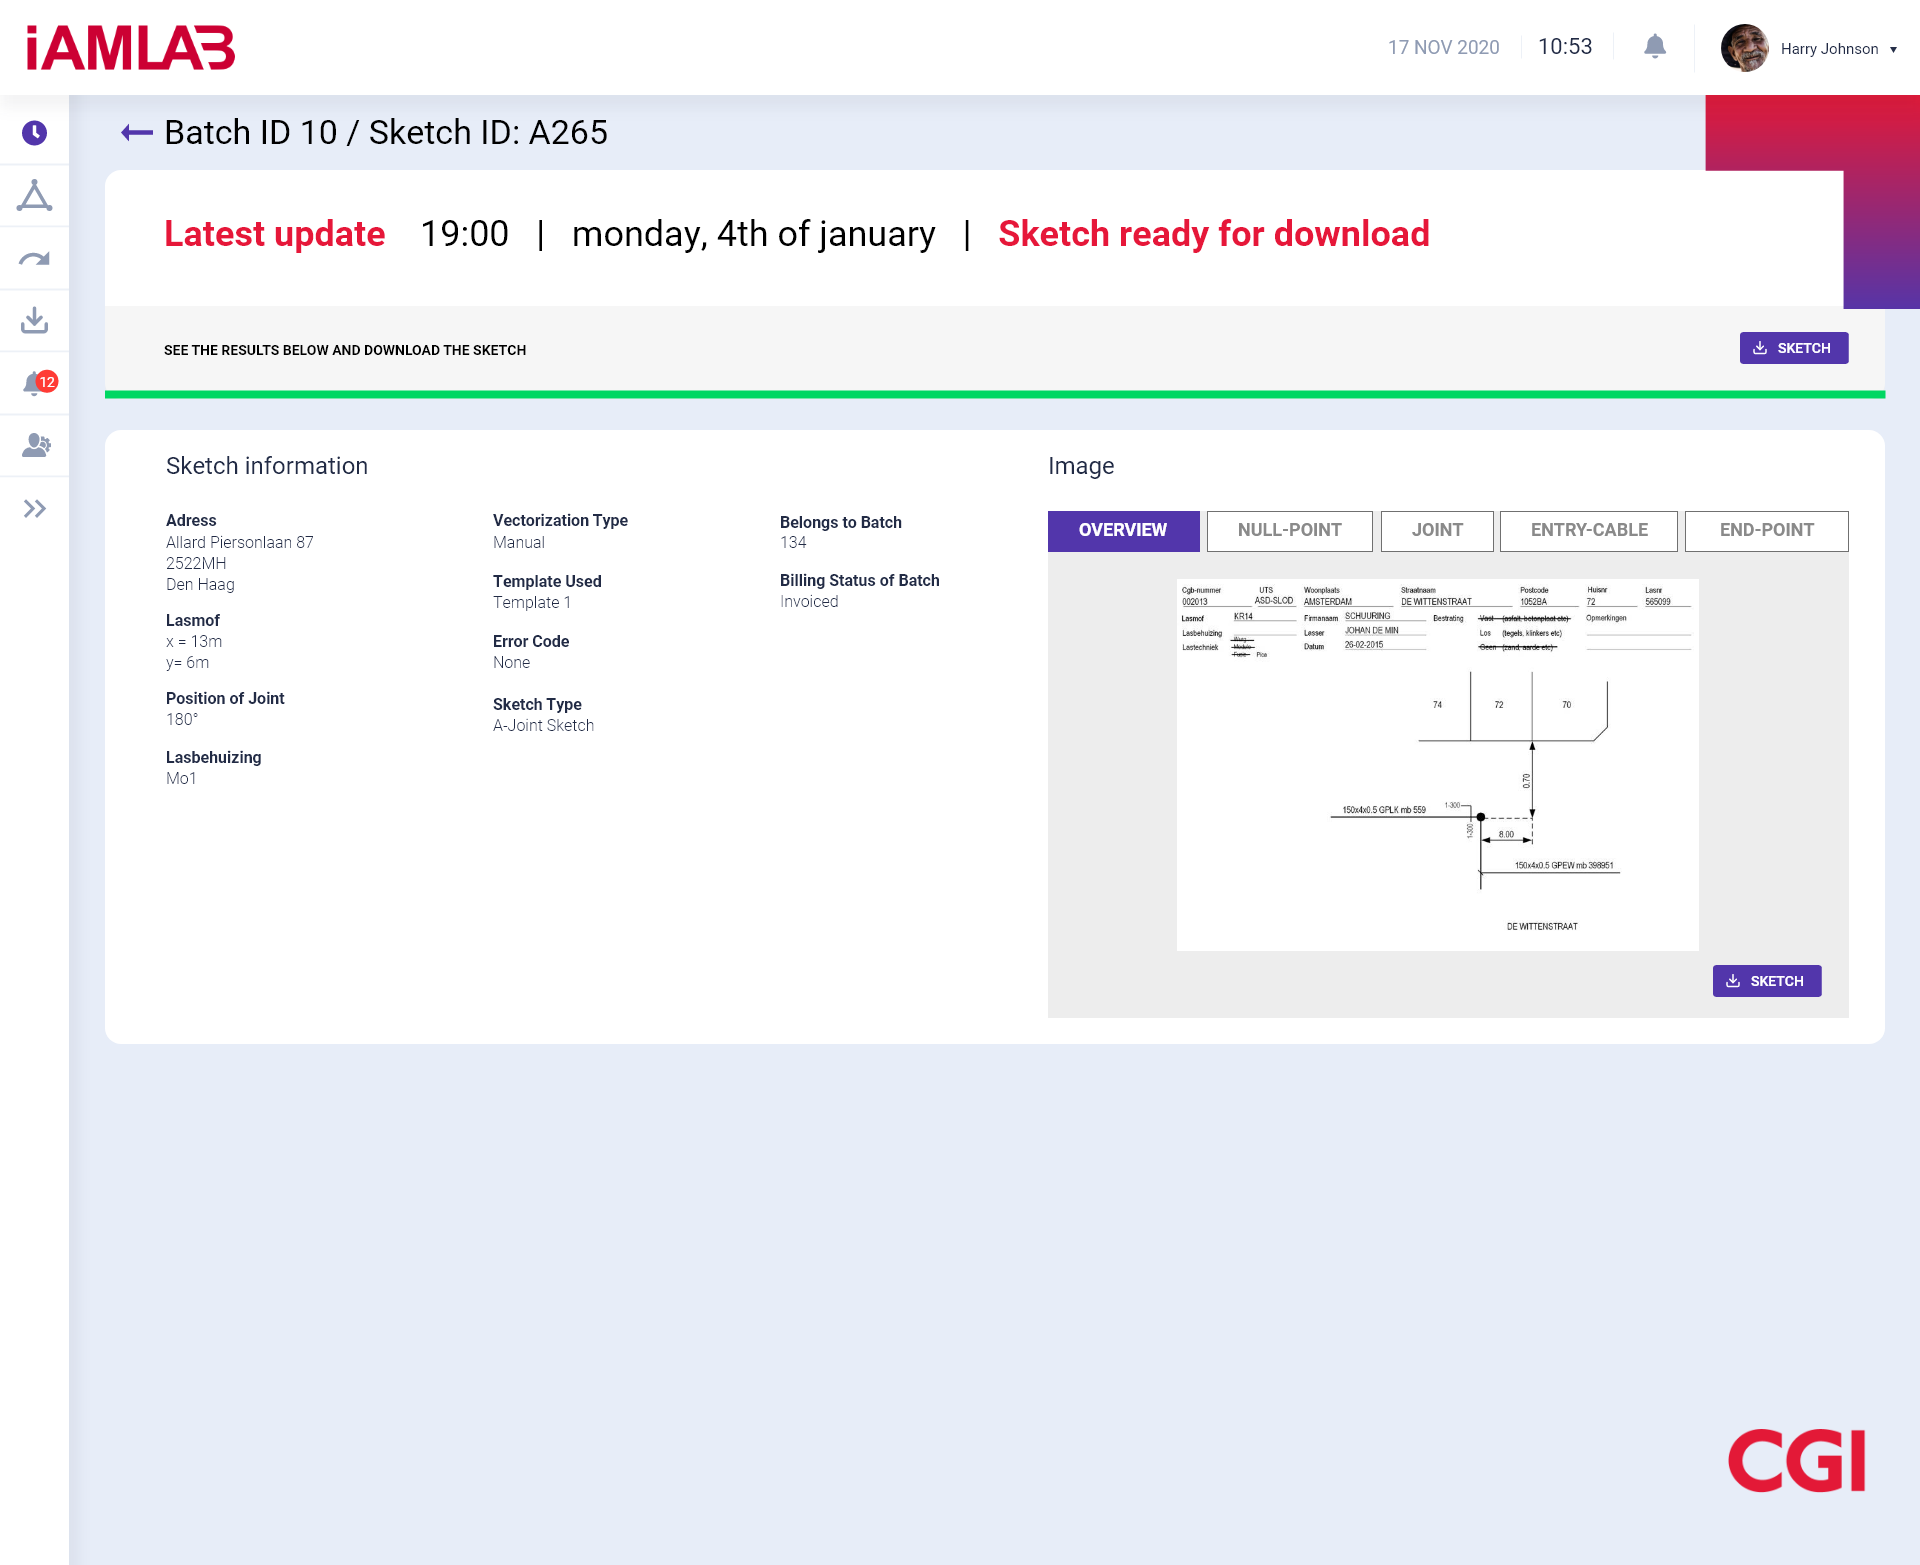
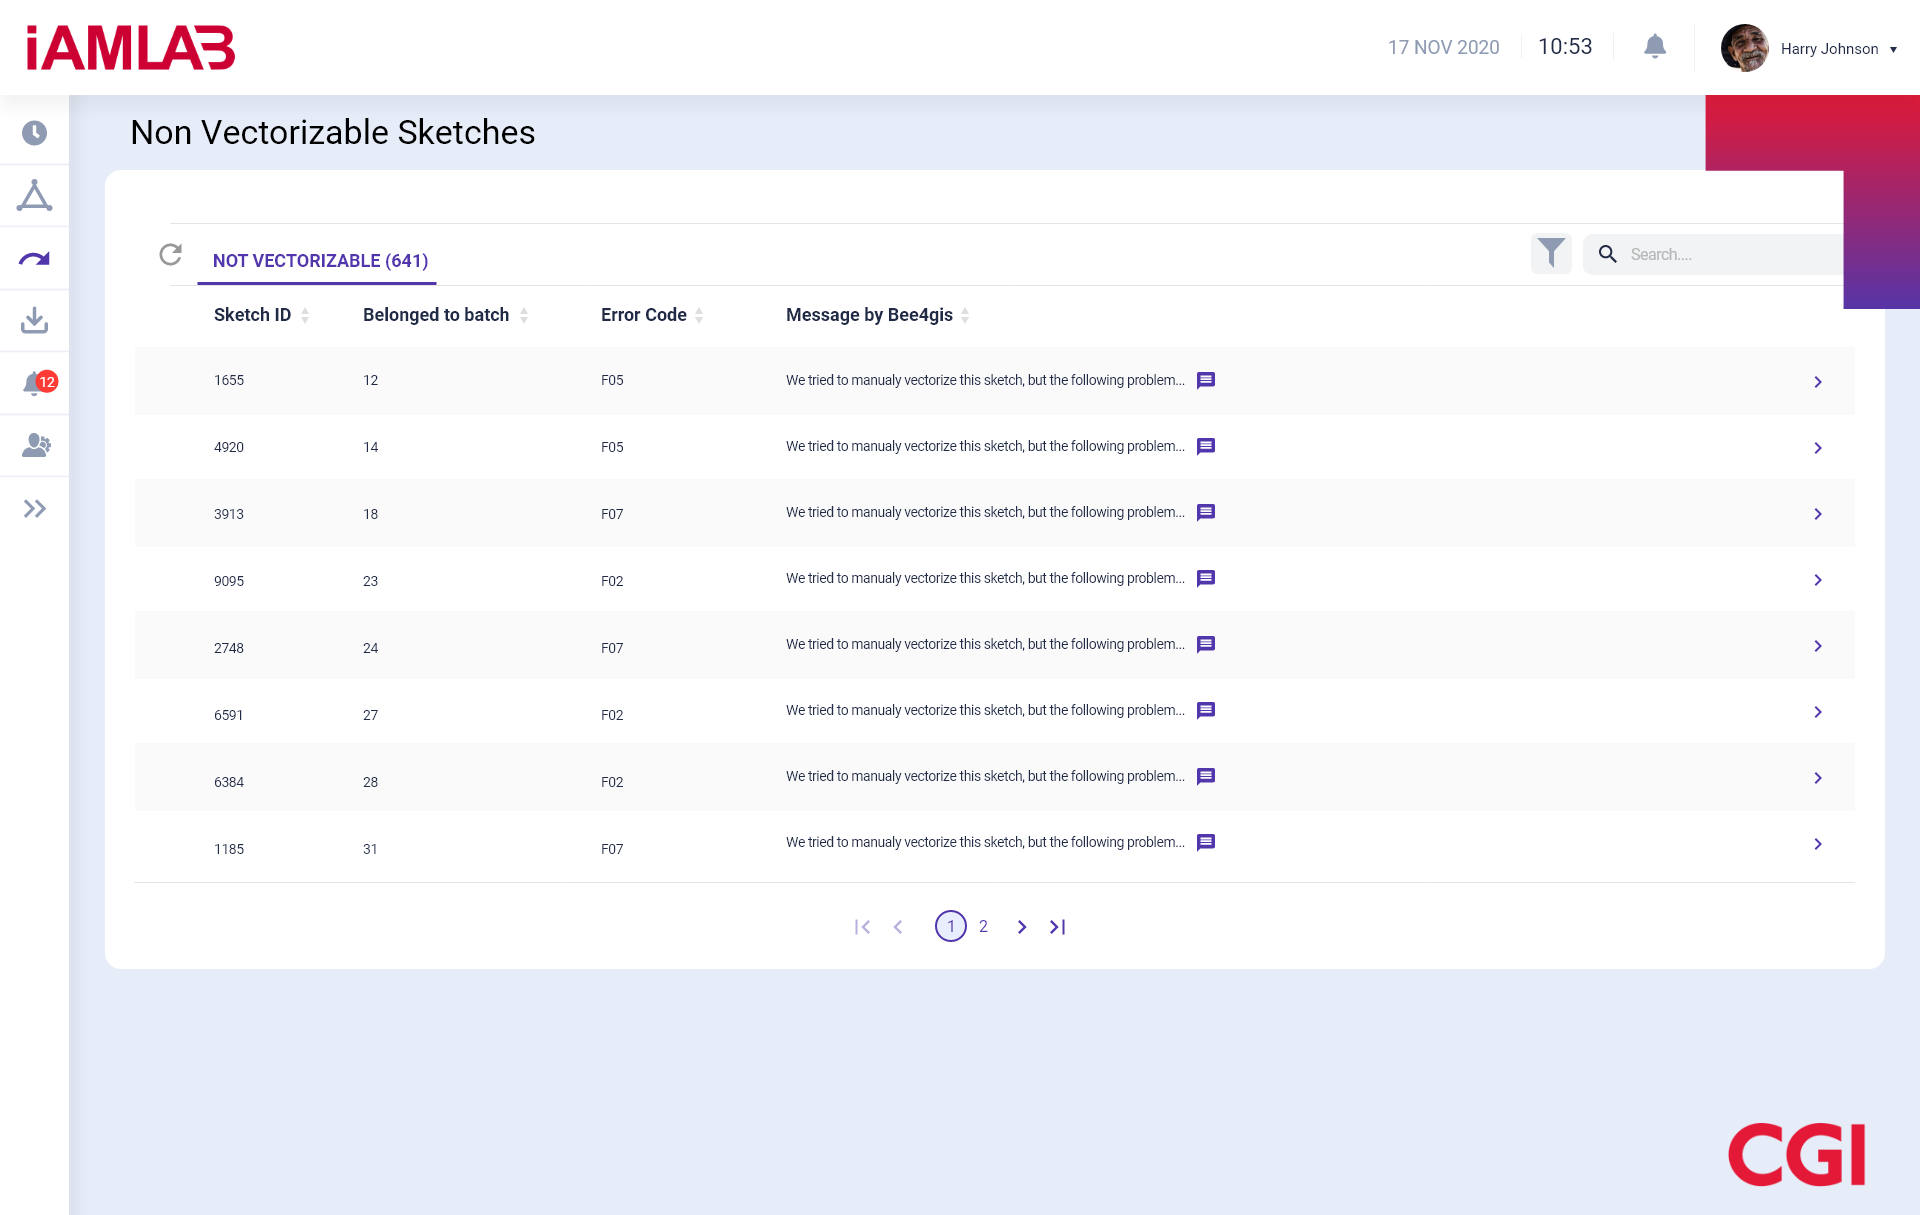
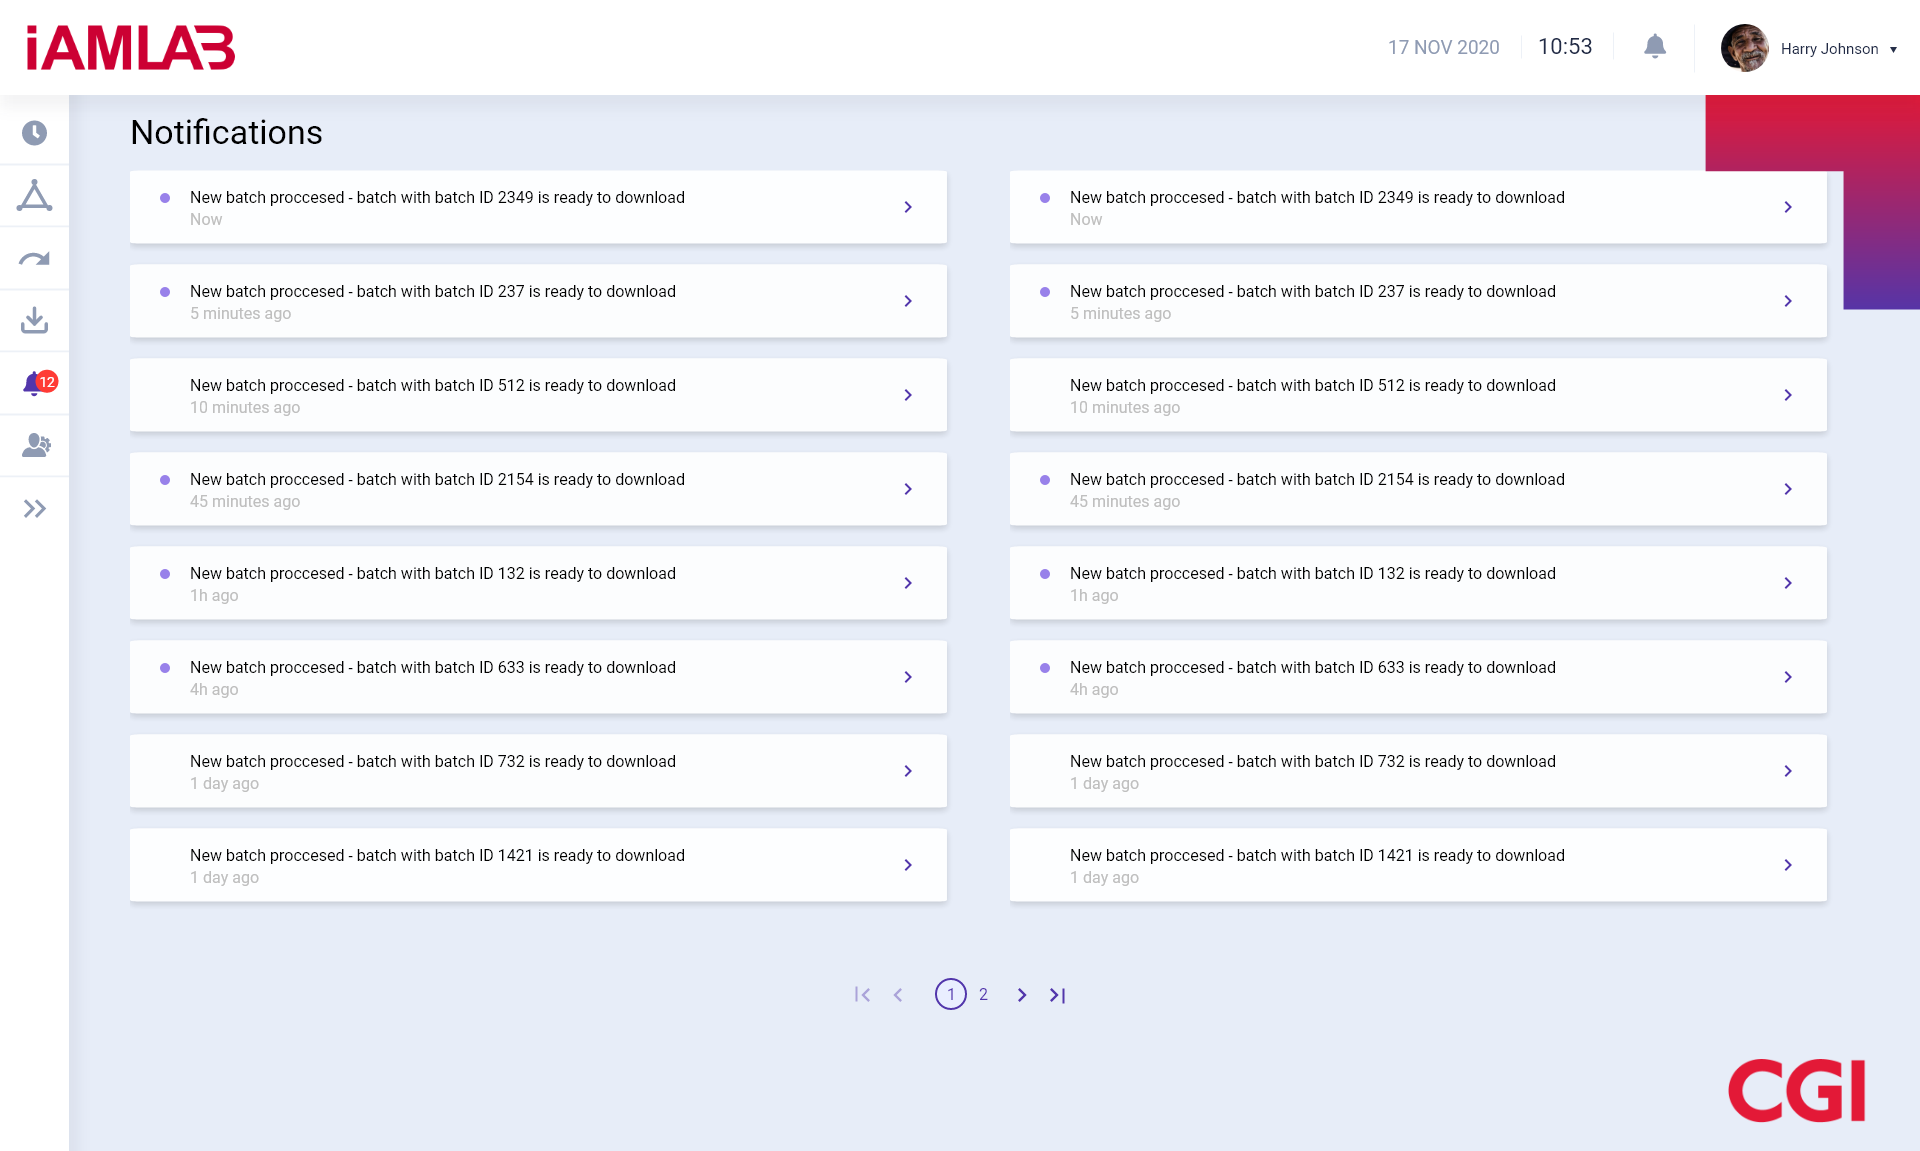
With each batch and each sketch within that you can see the individual progress by going into the detail pages. Within the batch detail page, for example, you have an overview of the completed tasks, see if there are places where problems arise and get notifications about the process.
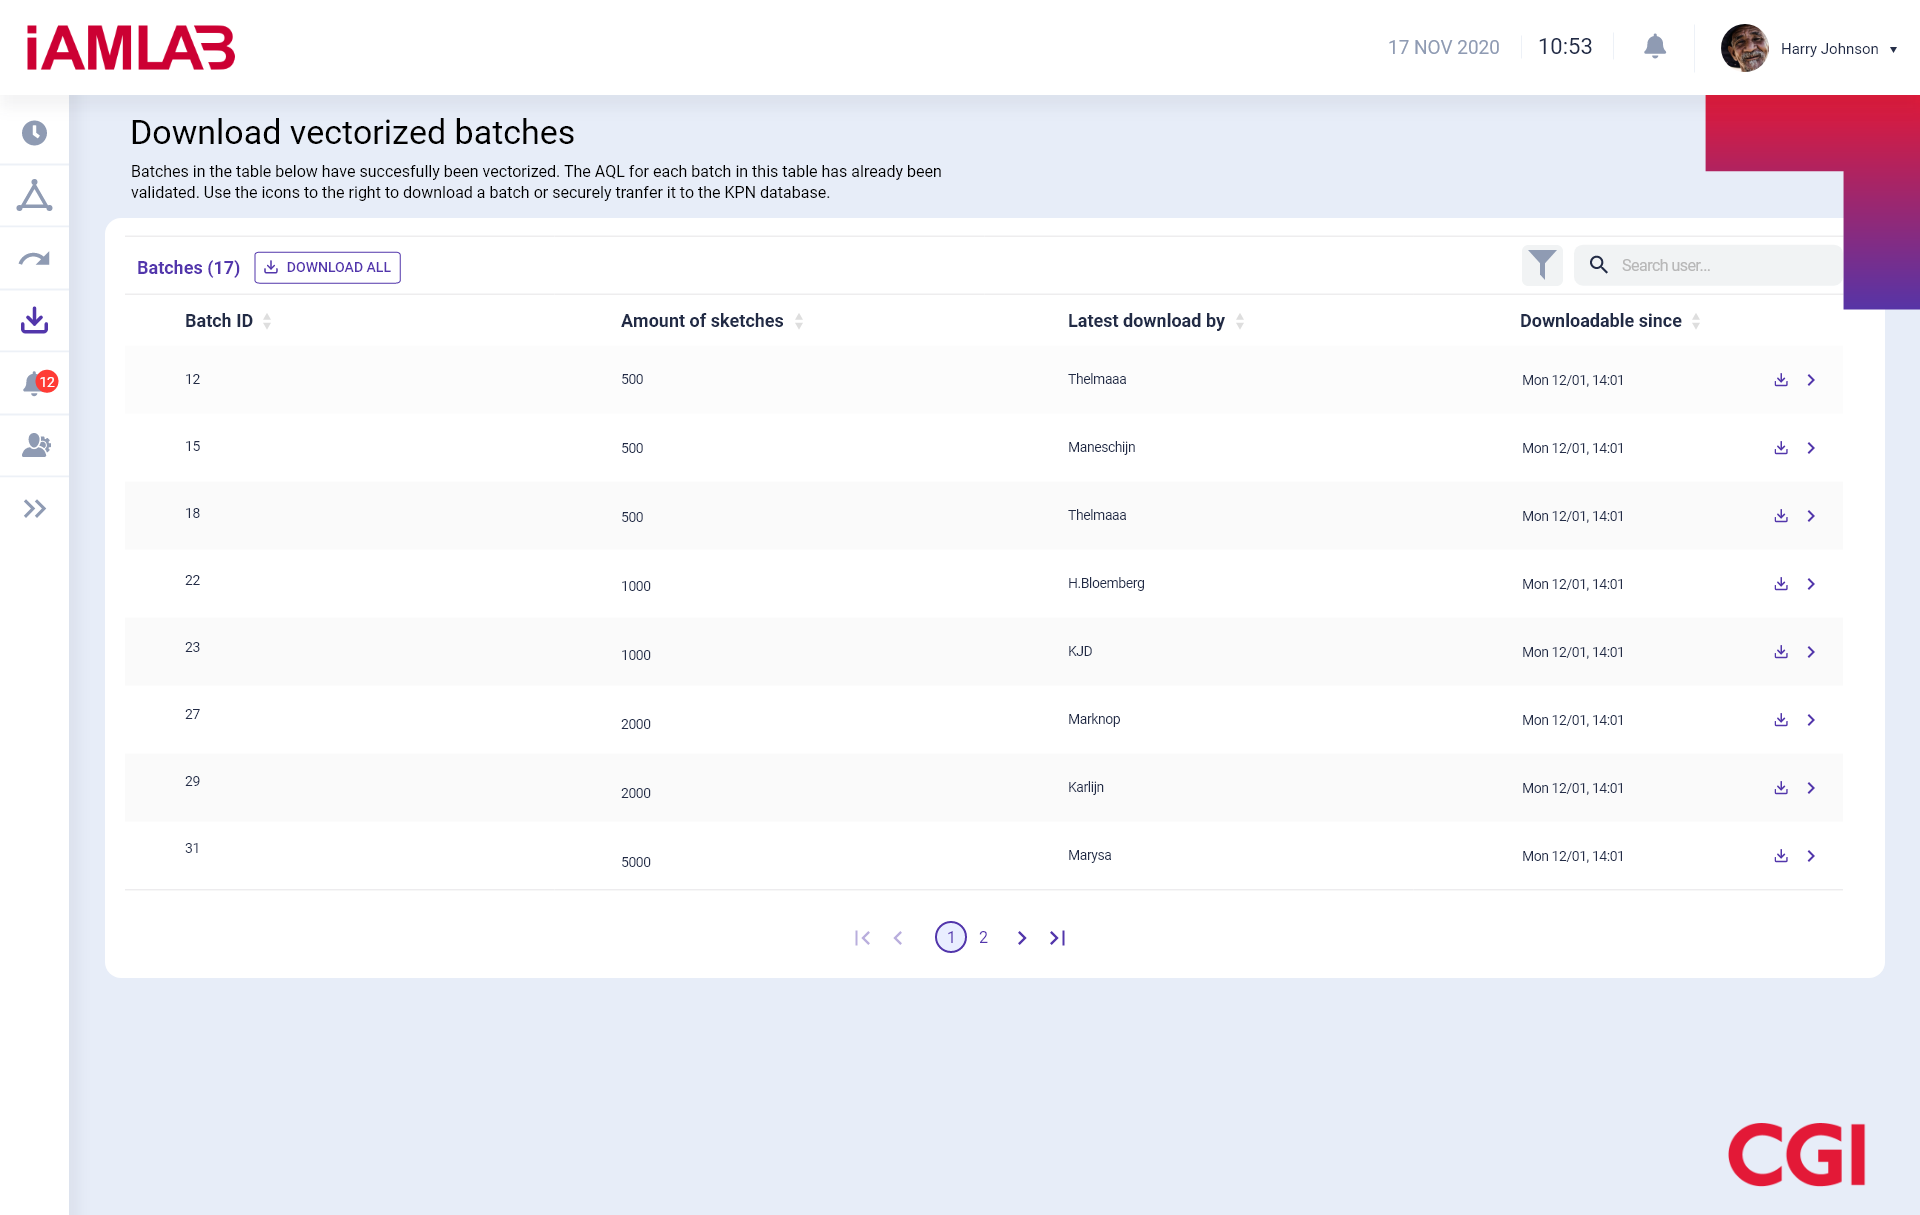
It is also possible to download the vectorised images for review or for use. This gives people the ability to easily access the data wherever they need it.
What I’m most proud of within this project is that I managed to work together with people from other departments really well. This vectorisation process is fairly difficult and long, but through good communication between the different departments I managed to integrate the full process into this portal without too much trouble.
Below this you can find the full design document for this project. I recommend to either download the file or read in presentation mode. The file is in Dutch.